
The Shabbat effect on Jerusalem's air
A 12-month natural experiment (2025-04-28 → 2026-04-28) using exact halachic time windows and two secular control cities.
The hypothesis
Jerusalem has an unusually strong weekly traffic cycle. Many streets in Shabbat-observant neighbourhoods empty out between candle-lighting on Friday and tzeit hakochavim on Saturday. The same is true (more universally) on the biblical chagim where driving is prohibited, and most starkly on Yom Kippur, when traffic effectively ceases nationwide — including among the non-observant.
If anthropogenic emissions drive a meaningful fraction of urban air pollution, the halachic calendar should produce a periodic, predictable dip in traffic-derived pollutants (NO, NO₂, NOx). Comparing the magnitude of that dip against the milder weekend cycle in secular cities lets us isolate the "Shabbat-as-natural-experiment" effect from the generic "weekend dip" seen in any city.
Headline result
NO₂ off-day vs workweek, median across stations, same 12-month window:
| City | Off-day | Workweek | NO₂ change |
|---|---|---|---|
| Jerusalem | Shabbat (candle-lighting → tzeit, exact) | Sun–Thu daytime | −62% |
| New York | Sat + Sun | Mon–Fri | −31% |
| London | Sat + Sun | Mon–Fri | −20% |
Jerusalem's Shabbat NO₂ drop is roughly 2× New York's weekend drop and 3× London's. The same direction holds for NO and NOx; PM2.5 is a far weaker and noisier signal in all three cities; ozone moves the opposite way (it rises slightly on off-days everywhere, consistent with reduced NOx scavenging).
Stratified by pollutant
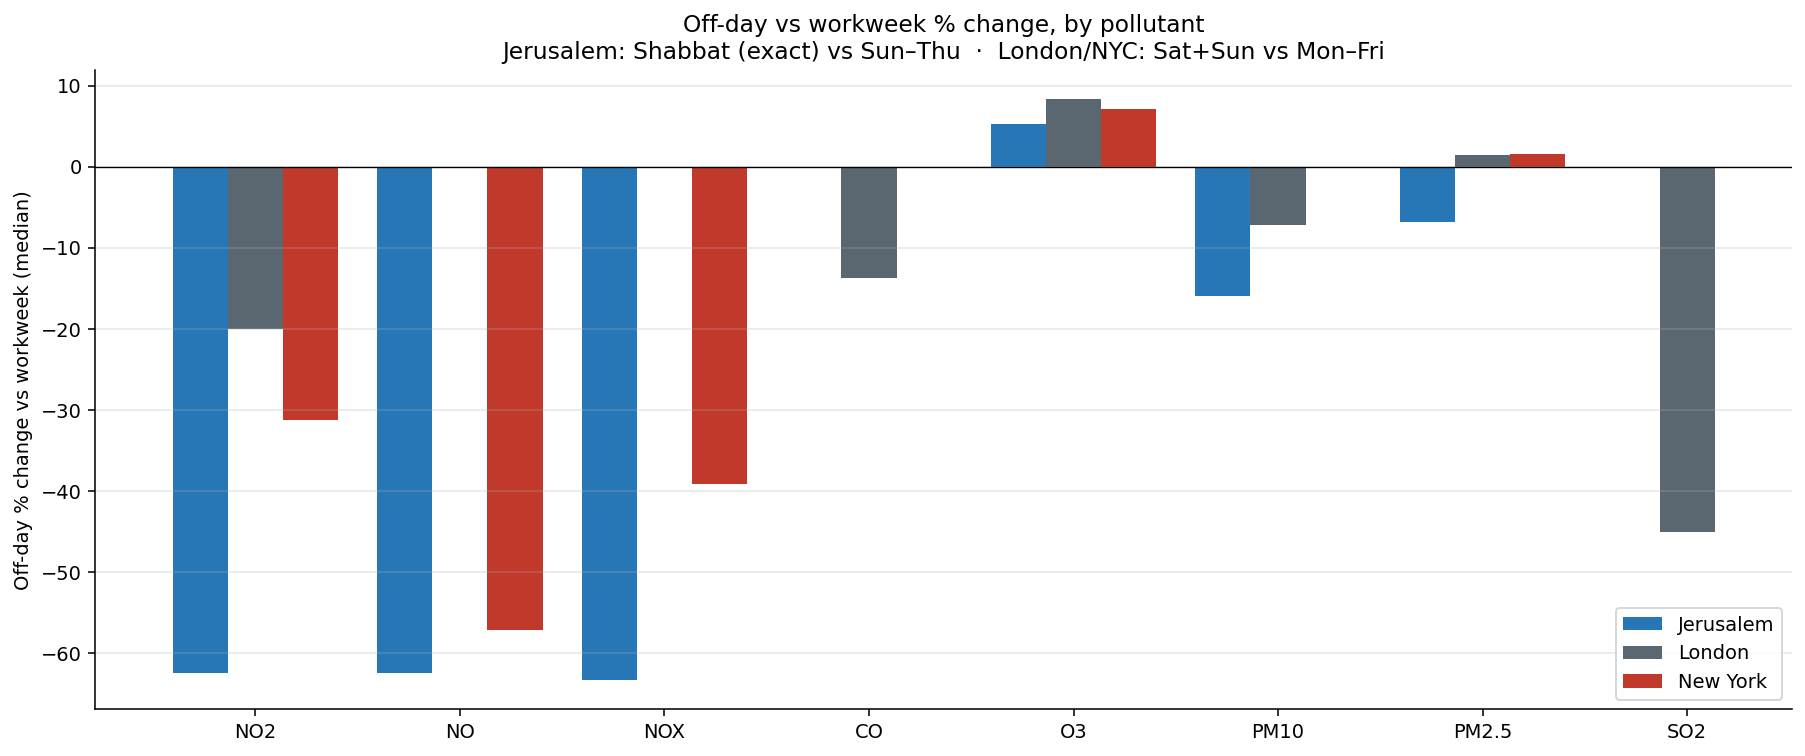
The headline is NO₂, but the dataset covers eight pollutants and they do not move together. The table and chart below show the off-day vs workweek percentage change for each city, by pollutant. Negative numbers mean cleaner air on off-days; blanks indicate the pollutant isn't reported by that city's stations.
Source: data/cross_city_offday_drop.csv. Off-day definition is Jerusalem = exact halachic Shabbat window; London / New York = Sat + Sun.
| Pollutant | Jerusalem | London | New York |
|---|---|---|---|
| NO₂ | −62.4% | −20.0% | −31.3% |
| NO | −62.5% | — | −57.1% |
| NOx | −63.4% | — | −39.1% |
| CO | 0.0% | −13.7% | 0.0% |
| O₃ | +5.3% | +8.3% | +7.1% |
| PM10 | −16.0% | −7.1% | — |
| PM2.5 | −6.8% | +1.4% | +1.6% |
| SO₂ | — | −45.0% | — |
NO₂ — nitrogen dioxide
The cleanest traffic-proxy in the dataset: short atmospheric lifetime (~hours), dominated by tailpipe emissions, and reported by stations in all three cities. Jerusalem's −62% drop is the largest signal in the study and the central piece of evidence for the hypothesis. New York (−31%) and London (−20%) show the generic urban weekend cycle — real, but roughly half and one-third the magnitude. The gap between Jerusalem and the controls is the "Shabbat premium" over a normal weekend.
NO — nitric oxide
NO is emitted primarily by combustion engines and converts rapidly to NO₂ in the presence of ozone. It collapses on Shabbat in Jerusalem (−63%) and on weekends in New York (−57%). London stations in this sample don't report NO. The Jerusalem and NYC numbers are closer here than for NO₂, suggesting that the NO₂ gap between the two cities is partly a chemistry effect (more sustained NO → NO₂ conversion in NYC's denser atmosphere) on top of the raw traffic reduction.
NOx — total nitrogen oxides (NO + NO₂)
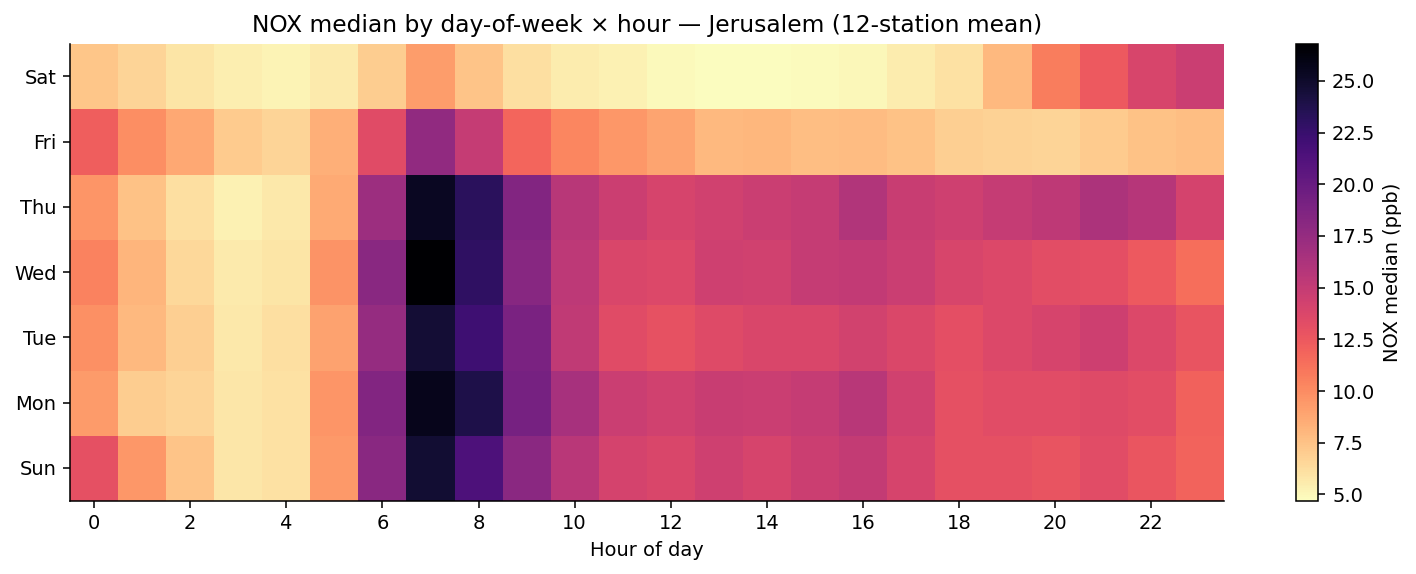
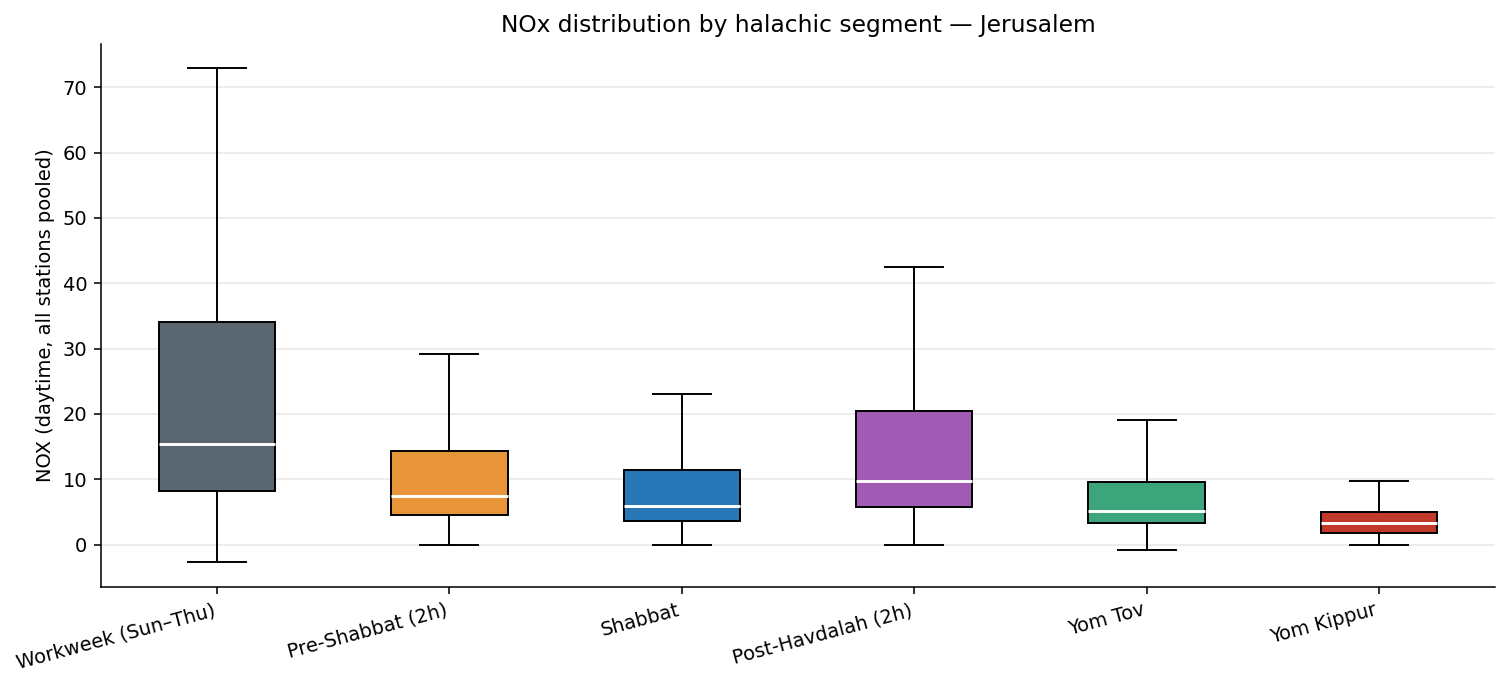
Combining NO and NO₂ removes the chemistry uncertainty and gives a cleaner read on raw combustion activity. Jerusalem drops 63%; New York drops 39%. London does not report NOx in this station set. NOx is the variable used for most of the Jerusalem-only panels (heatmap, hour-of-day curves, segment box plot) for this reason.
O₃ — ozone
Ozone is the only pollutant that moves in the opposite direction on off-days, and it does so in all three cities (+5% to +8%). This is the expected signature of NOx-saturated urban photochemistry: when NOx falls, less ozone is scavenged by NO, so ground-level O₃ rises slightly. The fact that Jerusalem's ozone bump is in the same range as London's and New York's — despite a far larger NOx drop — is consistent with non-linear ozone production chemistry rather than a direct emissions effect.
PM2.5 — fine particulates
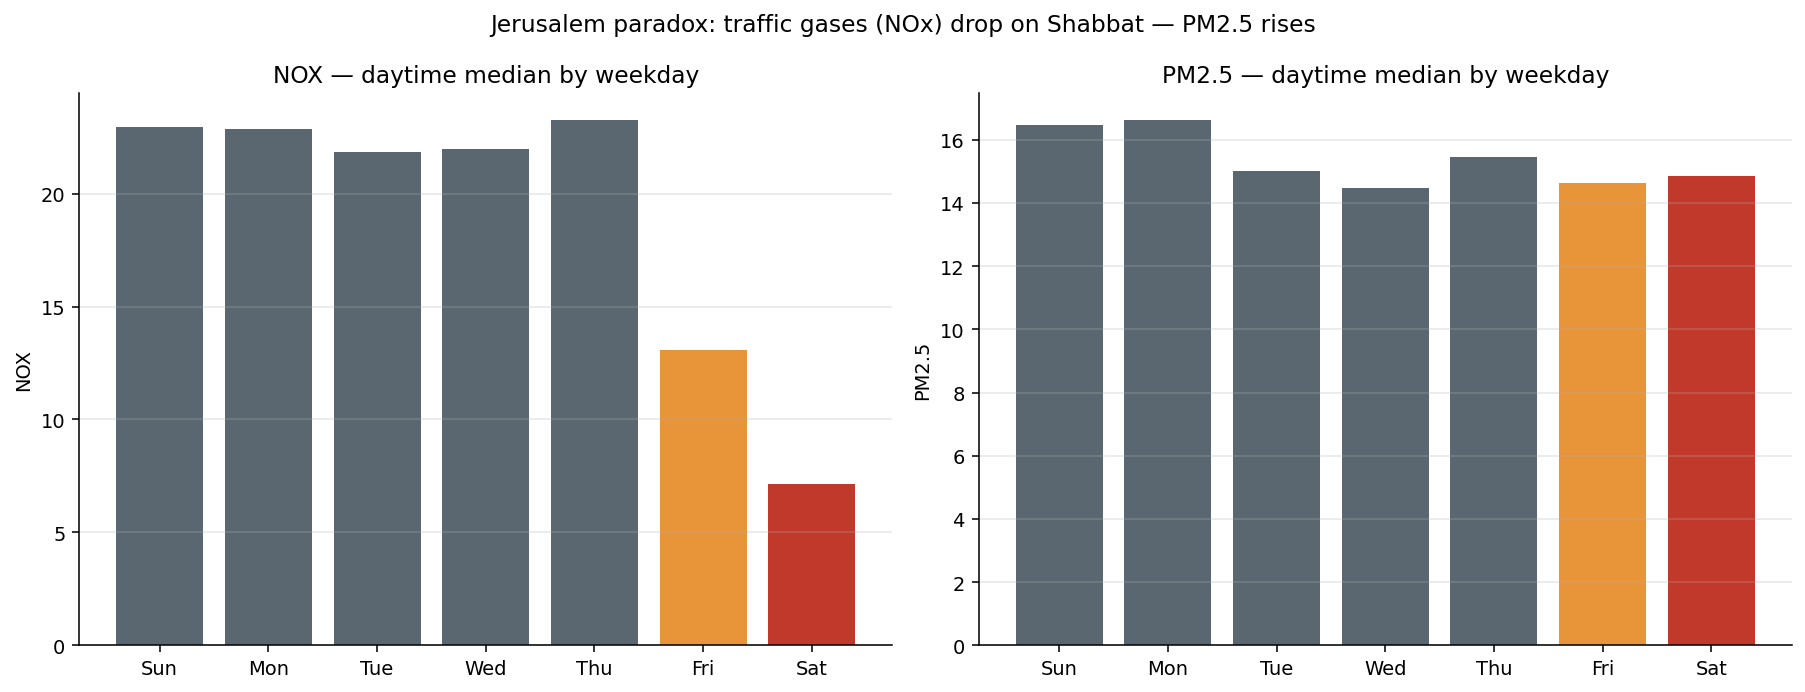
The hypothesis fails here, and that's interesting. Jerusalem shows only a −7% PM2.5 drop on Shabbat, and London and New York both show a slight increase on weekends. PM2.5 in this region is dominated by long-range transport (Saharan dust, regional smoke, secondary aerosol formation) on timescales of days, not hours, and is largely insensitive to a 25-hour traffic suspension. The 12-month sample is also disproportionately affected by spring 2026 dust intrusions that happened to fall on Saturdays — see caveats.
PM10 — coarse particulates
Jerusalem (−16%) shows a real PM10 drop on Shabbat — coarser particles include road dust and brake/tyre wear, which respond more directly to traffic reduction. London is milder (−7%); New York doesn't report PM10 at the included stations. The PM10 signal sitting between the strong NOx response and the absent PM2.5 response fits the "traffic-attributable fraction is highest in the coarser, primary-emission components" reading.
CO — carbon monoxide
Modern catalytic converters keep urban CO concentrations near detection limits except next to congested traffic. Jerusalem and New York report 0.0% change at the resolution of the station data; London shows −14%. Not a strong differentiator here, mostly because there is little signal left for any city to lose.
SO₂ — sulfur dioxide
Only London's stations report SO₂, and they show a −45% weekend drop — likely tied to commercial heating, shipping, and industrial activity rather than passenger traffic. Reported for completeness; no cross-city comparison is possible.
Jerusalem panels
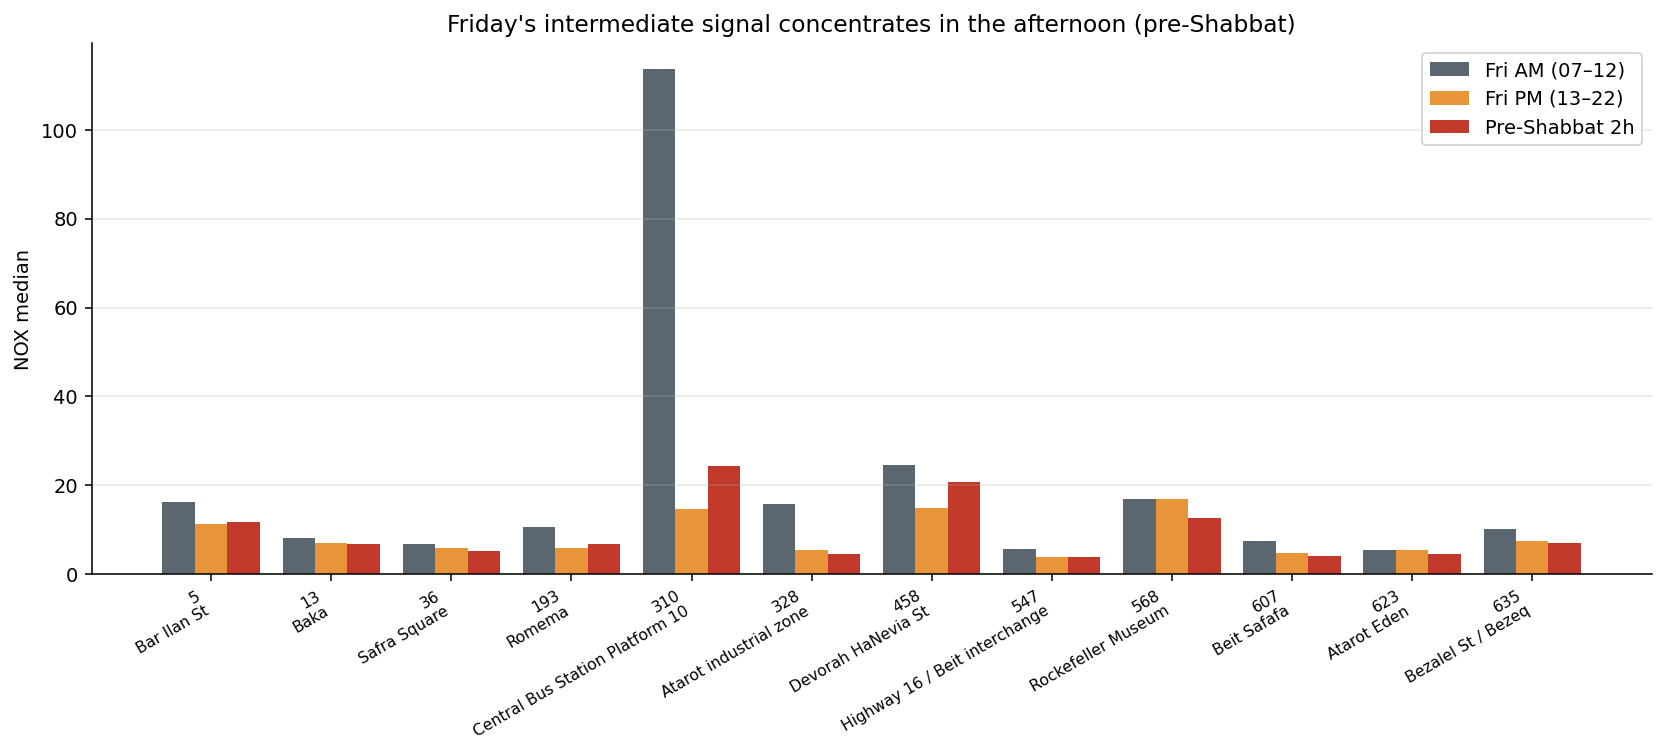
All Jerusalem-only figures use NOx unless noted, pooled across the 12 monitoring stations.



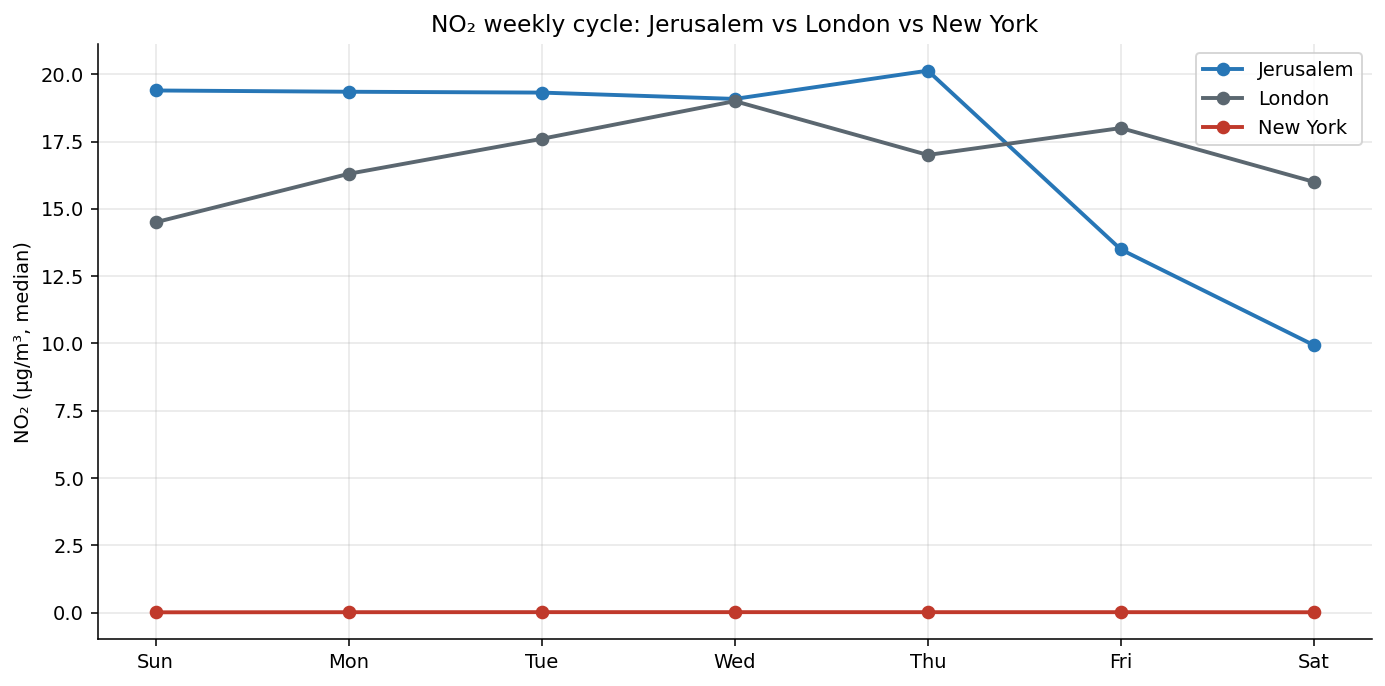
Cross-city control
Methodology
Halachic time-window labeling
The source dataset's coarse calendar flags
(is_friday, is_shabbat derived from day-of-week)
are superseded by exact halachic windows derived from
Hebcal
using Jerusalem coordinates and customs (40-minute candle-lighting offset;
tzeit hakochavim for end-of-Shabbat / end-of-chag).
| Flag | Window |
|---|---|
is_shabbat | candle-lighting → havdalah, weekly Shabbatot only |
is_yom_tov | onset → conclusion of biblical chagim with driving prohibition (incl. Yom Kippur) |
is_yom_kippur | exact YK window — broken out separately |
is_pre_shabbat | 2 hours before candle-lighting — the erev-Shabbat shopping rush |
is_post_havdalah | 2 hours after havdalah — the post-Shabbat rebound |
Plus a derived segment column resolving these flags into
a single mutually-exclusive bucket
(weekday, pre_shabbat, shabbat,
post_havdalah, yom_tov, yom_kippur)
for clean grouping. Chol HaMoed is intentionally not
flagged — driving is permitted, so it is indistinguishable from a weekday
for the traffic hypothesis.
Cross-city segmentation
| City | Workweek | Off-days |
|---|---|---|
| Jerusalem | Sun–Thu | Shabbat (exact halachic window); Yom Tov / Yom Kippur reported separately |
| London | Mon–Fri | Sat + Sun |
| New York | Mon–Fri | Sat + Sun |
Each city uses its own off-day convention: the comparable cross-city quantity is "what happens when residents are on their conventional rest days?" NO₂ values were converted from ppb (Jerusalem source) to µg/m³ (OpenAQ convention, 1 ppb ≈ 1.88 µg/m³ at 25 °C, 1 atm) for the overlay charts.
Caveats
- 12 months of data means the 50 Shabbatot in the sample are bound to whatever weather and dust events occurred. Spring 2026 Saharan dust intrusions inflate PM2.5 on a handful of Saturdays and partly explain why the PM signal is weak/flipped.
- The "weekday baseline" excludes Yom Tov and Yom Kippur hours but does not control for meteorology, seasonality, or year-over-year trend. A meteorology-residualised version is the obvious next step.
- The pre-Shabbat 2-hour and post-Havdalah 2-hour windows are heuristic. The true rush durations probably vary by season and neighbourhood.
- East Jerusalem stations (notably Rockefeller Museum / 568) carry traffic that does not observe Shabbat. They show the smallest drops — itself a useful internal control.
- Three London and four New York stations is a small geographic sample; more stations might pull the control numbers in either direction.
Sources & citation
- Air quality (Jerusalem): Israeli Ministry of Environmental Protection — air.sviva.gov.il
- Air quality (London / New York): OpenAQ
- Halachic times: Hebcal (Jerusalem coords, 40-min candle-lighting offset, tzeit hakochavim for havdalah)
- Source dataset: danielrosehill/Jerusalem-Air-Quality-Shabbat
- Analysis code: github.com/danielrosehill/JLM-Air-Quality-Analysis
Analysis code: MIT. Figures and labeled parquet: CC-BY-4.0, matching the upstream dataset. Underlying air-quality measurements remain attributable to the original sources above.